

& Bryggervangen, Copenhagen.
Climate Adaptation Public Space
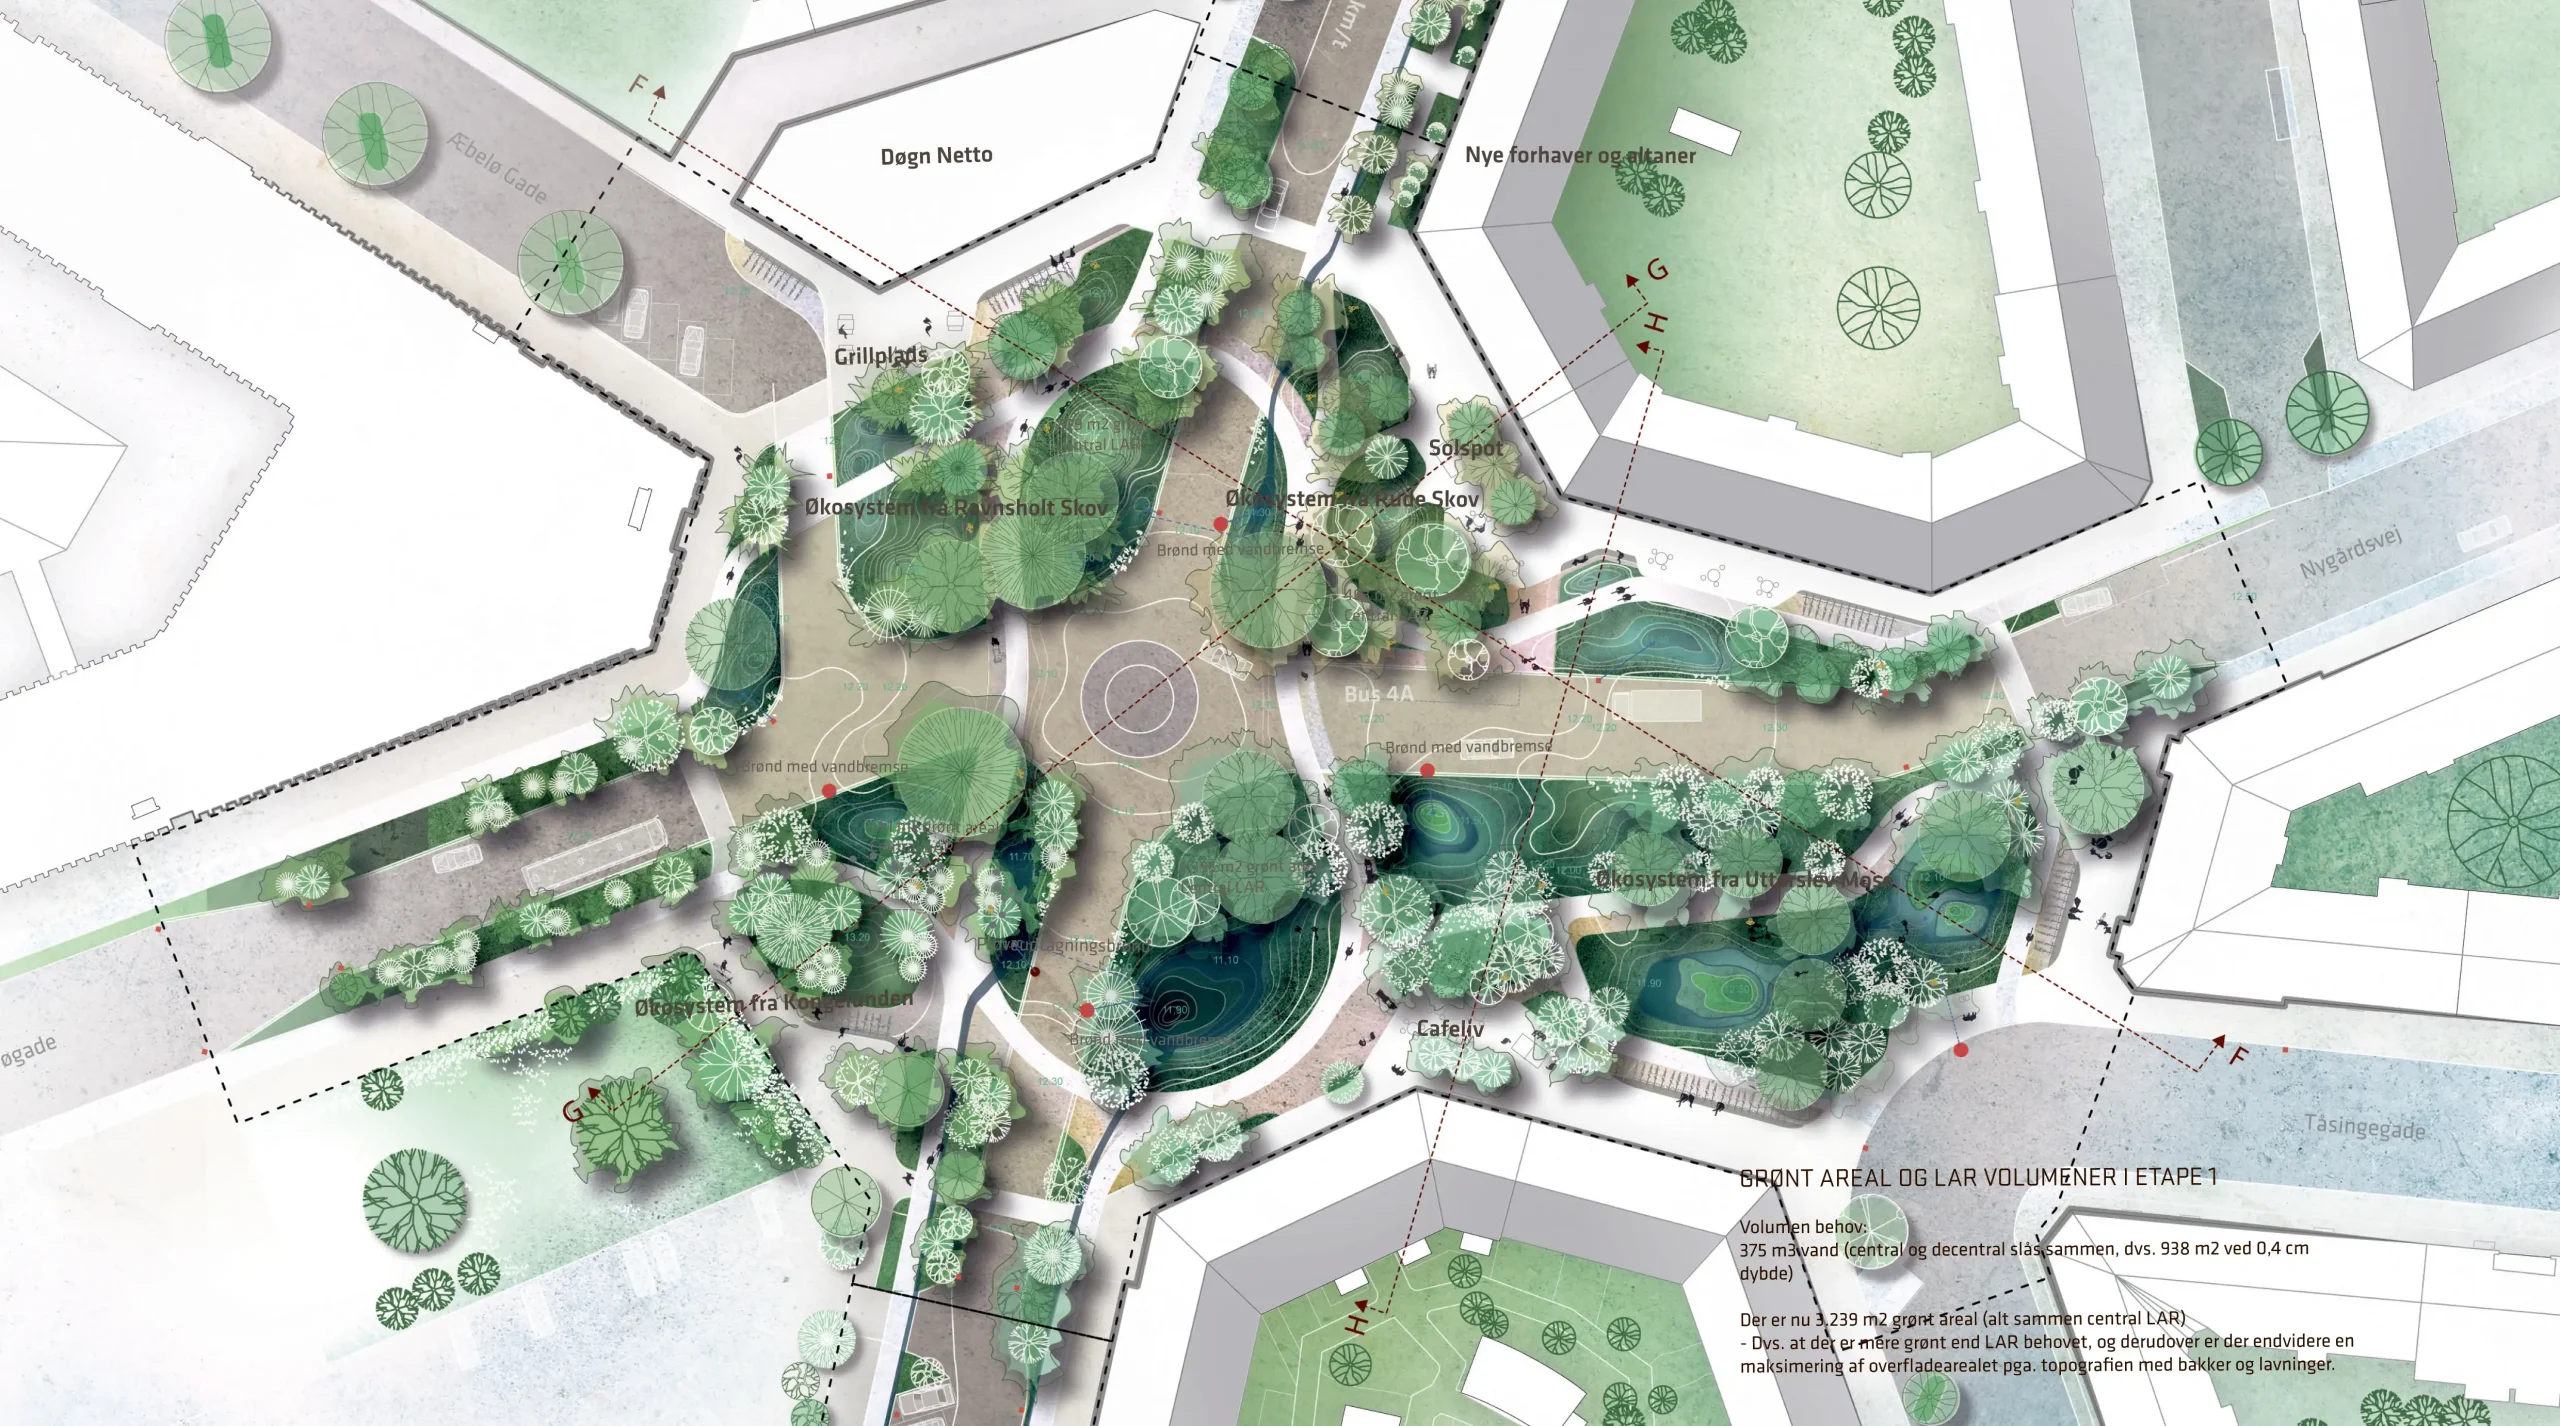
DKK 48.45M investment — what a 2019 analyst would have predicted, and what seven years of validated data confirmed.
A Phase 1 Desk Assessment — conducted remotely from drawings, site plans, and publicly available data. All projections were made at design stage. The 2026 figures are post-occupancy validated outcomes.
Indicators were selected based on the purpose of the design (climate adaptation, public space), public data availability for Copenhagen, and measurability within a Phase 1 framework.
Type 1 (Calculated) — quantified, sourced, defensible monetary value assigned.
Type 2 (Evidenced) — documented effect, no monetary figure assigned at Phase 1.
The project was designed to achieve 30% surface infiltration across its catchment. Post-completion monitoring confirmed 50% — almost double the specification.
The economic value is calculated against HOFOR's published 2026 tariff schedule. The 60% outperformance is driven entirely by technical delivery exceeding design specification — not by tariff growth.
The biological projection was accurate to within 3.4% — the trees sequestered almost exactly what the IPCC age-bracket methodology predicted. The 107% value increase came entirely from EU ETS carbon prices rising from ~€42 to €90/tonne.
The 586 trees are an appreciating asset. Between 2026 and 2030, annual carbon value is projected to increase by 159%.
The 2019 market baseline grew far faster than forecast — a post-COVID surge no model predicted. But the green premium estimate proved accurate: 5% projected, 4.5% validated. The methodology measured the right thing correctly.
For municipalities: DKK 14.5M annual tax increment = fiscal payback in approximately 3.2 years. For private developers: DKK 428M neighbourhood asset creation = 8.8× project investment.
The 2019 temperature prediction was accurate to within 0.1°C. The methodology applied IPCC-derived tree cooling coefficients to the design specification — 586 trees across 48 species replacing 9,000 m² of asphalt.
The health cost is calculated using a published EPFL/Nature Communications coefficient (Manoli et al., 2023) of €192 per adult per year, applied proportionally to the 17.2% cooling contribution of the project.
Cross-referencing SLA's 2026 monitoring report (34.9°C → 28.9°C = 6.0°C = 17.2%) confirms the mid-scenario prediction was met precisely.
A monetary value is not assigned to this indicator. Doing so without clinical outcome data — measured changes in depression rates, GP consultations, or anxiety scores in the catchment — would be an inflation, not an assessment. The effect is real, evidenced, and documented.
Design projection vs. validated outcome, 2026. Every indicator met or exceeded its 2019 forecast.
Maintenance cost estimated at DKK 903,000/yr — NIRAS (2017) Danish wadi/swale-trench benchmark €3.47/m² · Source: UGREEN D2.3, EU Horizon 2020.
Precision refinements and unquantified value streams identified for the next assessment cycle.
GIS-based pedestrian catchment delineation for UHI and access equity analysis.
Species-level carbon measurement replacing IPCC age-bracket coefficients for greater precision.
Independent hedonic sub-area analysis (properties within 300–500m) to verify green premium.
Flood damage avoidance modelling using JRC Huizinga damage functions.
Building cooling energy savings attributable to UHI mitigation — currently unquantified.
Clinical outcome monitoring — GP data and self-reported surveys for QALY conversion.
This is a high-level summary of the Phase 1 assessment. Request the full comprehensive technical report to review our methodology, data sources, and full economic modelling.